Ethereum price forecast for 2024-2033: will ETH soon reach $8000
Analysts are trying to look into the future and give their forecasts for the price of the second cryptocurrency ETH

Today's Ethereum price is $3,687 and the 24-hour trading volume is $12,612,053,972. Over the past 24 hours, Ethereum has fallen by 1.38%. The current CoinMarketCap rating is 2 and the real market capitalization is $405,184,227,131. There are 120,073,429 ETH coins in circulation.
The latest Ethereum price analysis update is bullish:
- Support levels are stable at $3168.8.
- The resistance level is steady at $4,171.8.
Ethereum 1-Day Price Chart: Ethereum Faces Resistance, Tests Key Support Level
On the daily chart, Ethereum (ETH) is experiencing a period of volatility as evidenced by widening Bollinger Bands, with recent price action moving towards the lower band, indicating bearish sentiment. After a noticeable uptrend, the price is currently experiencing a pullback. The moving average (orange line) is trending higher, reflecting the previous bullish phase, but the price fell below the 20-day simple moving average (blue line), hinting at possible bearish momentum.
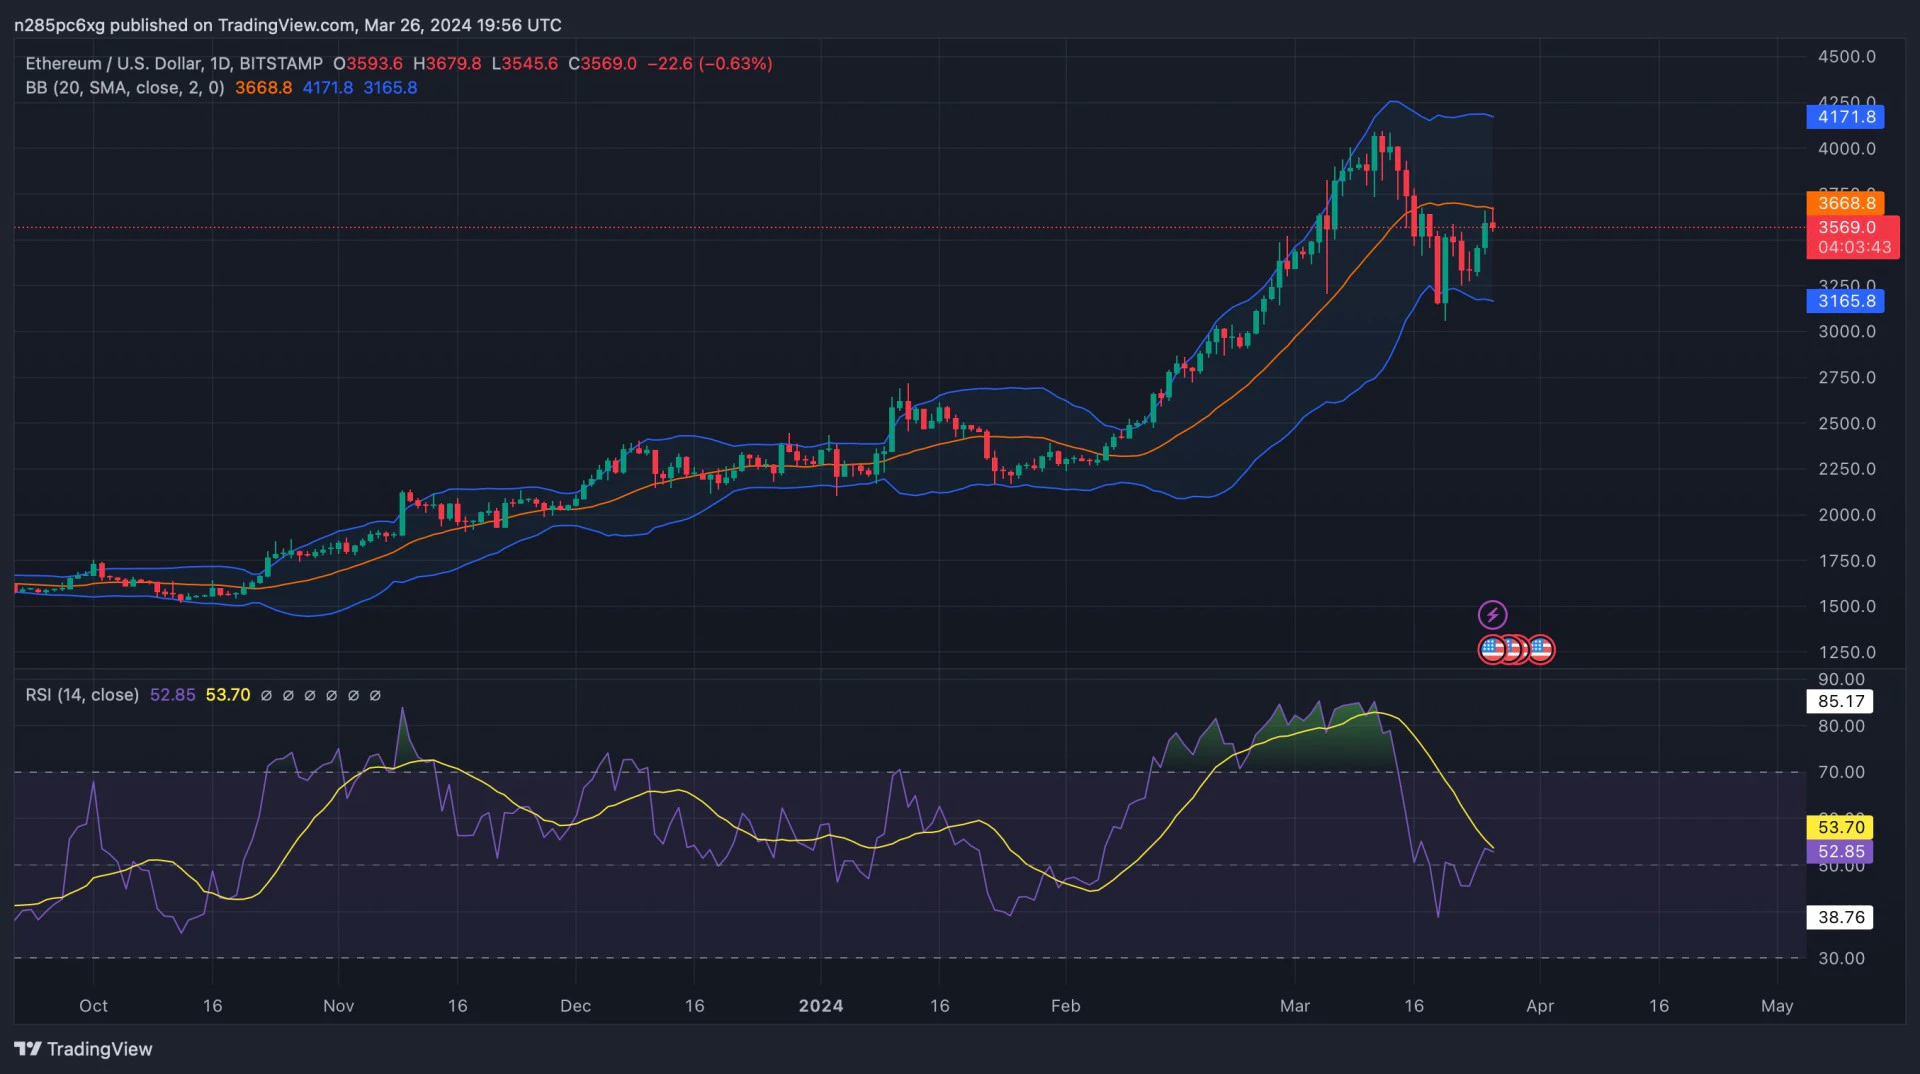
The Relative Strength Index (RSI) is at 53.70, down from higher levels, indicating a loss of upward momentum, but still neutral with no immediate signs of overbought or oversold.
Price points to watch include the recent high around $4171.8 with support near $3168.8. The current price is hovering around $3569.0, which is critical as it sits just above the mentioned support level, making it a key area to watch for a potential recovery or further decline.
4-hour Ethereum price analysis: ETH broke resistance on the 4-hour chart
On the 4-hour chart, Ethereum (ETH) is showing a bullish breakout, having recently broken through the upper Bollinger Band, indicating strong buying pressure. Moving Average Convergence Divergence (MACD) supports bullish sentiment, with the MACD line (blue) well above the signal line (orange) and the histogram showing increasing bullish momentum.
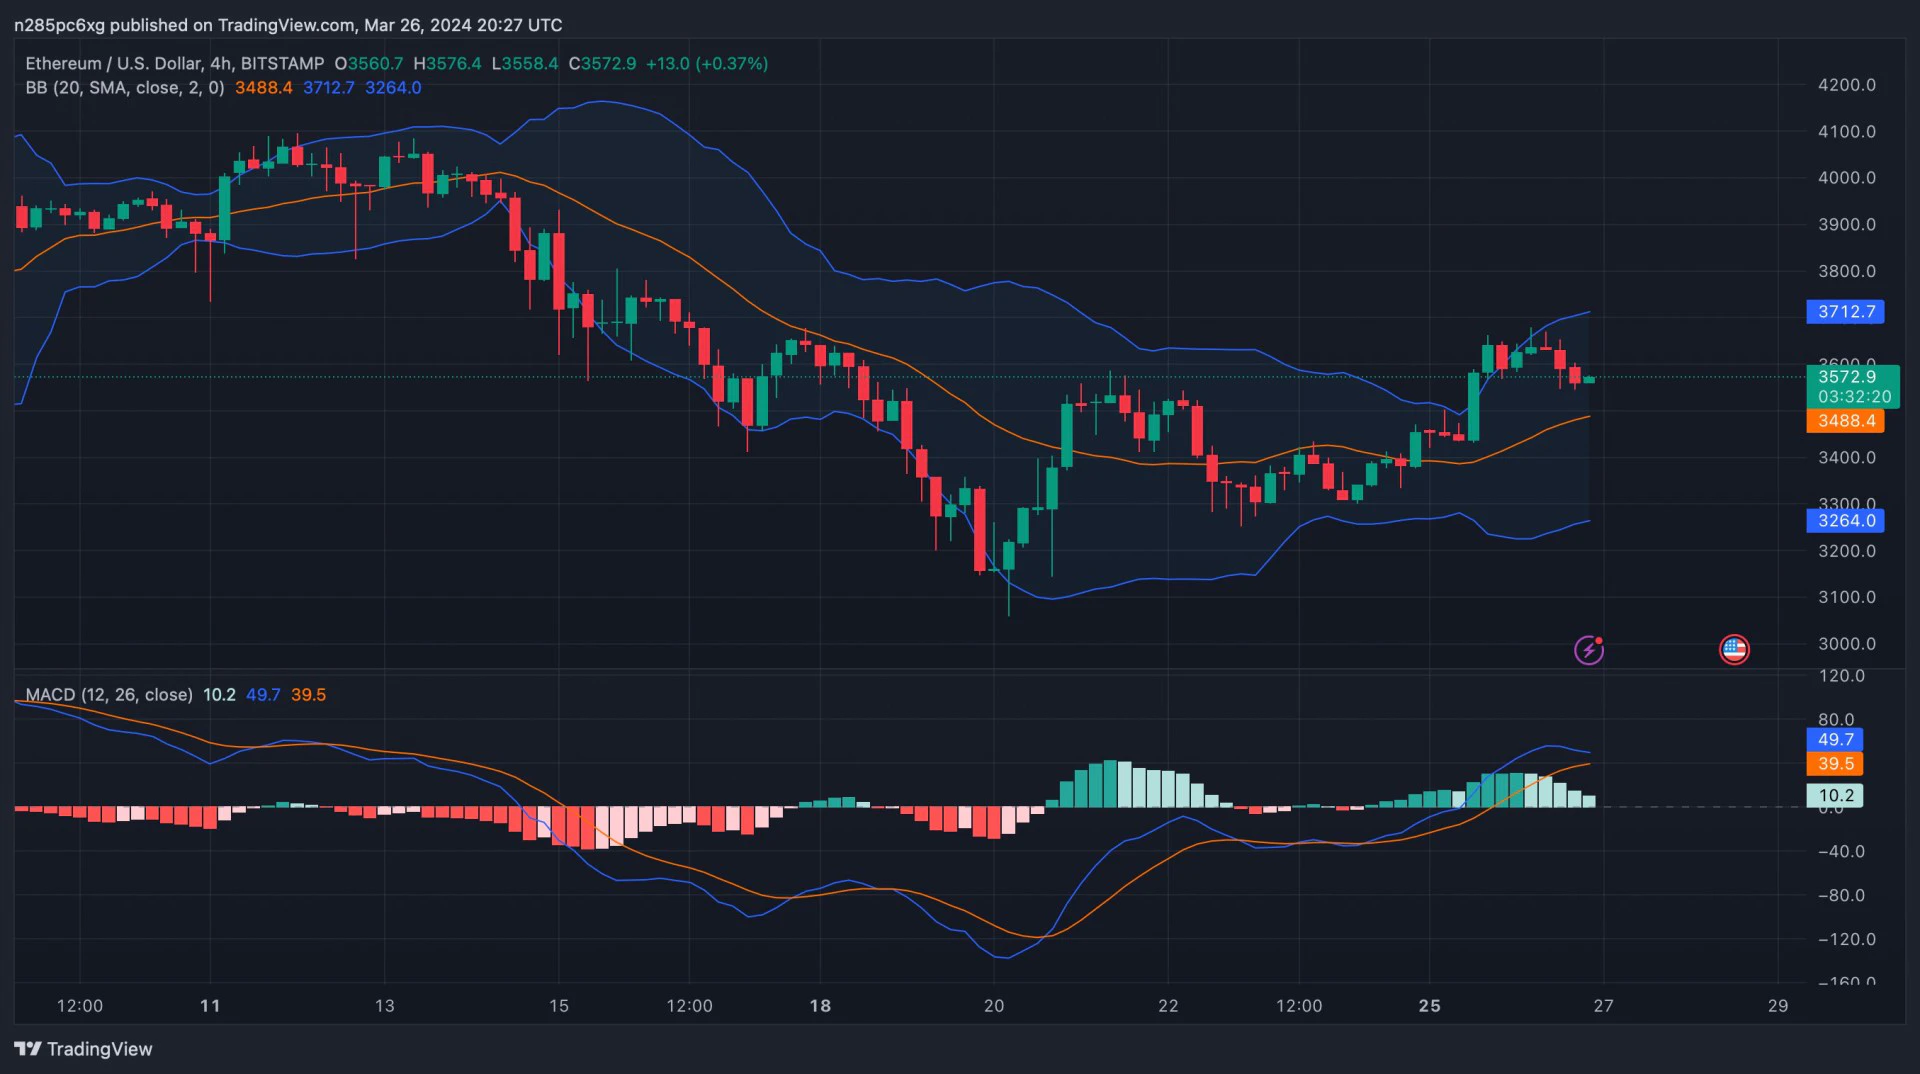
The recent price at the time of charting was around $3699.7 and the recent high was $3718.7, indicating possible resistance. Notable support lies at $3181.0, as evidenced by the lower Bollinger Band. The price is well above the 20-period moving average (orange line), which could act as dynamic support at $3449.8. The positive momentum suggests traders are currently bullish on ETH but are anticipating potential pullbacks to the moving average for entries.
On the chart, the cryptocurrency is rising above key resistance levels, and the MACD is showing a strong buy signal. However, the daily chart tempers this optimism, showing a recent pullback as prices touched the lower Bollinger Band, suggesting caution is warranted. The juxtaposition of these two time frames means that while the short-term outlook is positive, there could be potential resistance and profit-taking ahead.
Ethereum price forecast for 2024-2033
- Ethereum price forecast for 2024 – up to $4853
- Ethereum price forecast for 2027 – up to $13,536
- Ethereum price forecast for 2030 – up to $42,373
- Ethereum price forecast for 2033 – up to $135,505
Earn $25 right now!
$25 welcome bonus to all new Binance users.